In This Guide
- What Is ATAR Scaling and Why Does It Exist?
- How Scaling Works — A Simple Explanation
- How Each State Handles Scaling
- Subjects That Typically Scale Up
- Subjects That Typically Scale Down
- 5 Common Scaling Myths — Busted
- Should You Pick Subjects Based on Scaling?
- How to Use the ATAR Scaling Calculator
- 10 Tips for Navigating ATAR Scaling
- Frequently Asked Questions
ATAR scaling is the single most misunderstood part of the Year 12 system. Students hear that some subjects “scale up” and others “scale down,” and the immediate instinct is to game the system — pick the subjects that scale highest, regardless of interest or ability.
That instinct is wrong. And this guide explains exactly why.
Scaling exists to make the ATAR fair, not to reward subject choice. It adjusts raw scores so that a student who scored 75 in a harder subject is not disadvantaged compared to a student who scored 75 in an easier one. Without scaling, the system would punish students who challenge themselves.
This guide covers how scaling works in every Australian state, which subjects historically scale up or down (with real numbers), the myths you should stop believing, and how to actually use scaling information to make smarter subject choices. If you want to see how scaling affects your own subjects right now, try the ATAR Scaling Comparison Tool.
What Is ATAR Scaling and Why Does It Exist?
ATAR scaling is the process of adjusting raw subject scores so that results from different subjects can be compared fairly. It exists because not all subjects are equally difficult, and not all student cohorts are equally strong.
Here is the core problem scaling solves: imagine two students. Student A scores 80 in Specialist Maths. Student B scores 80 in a less demanding subject. Without scaling, the system treats both 80s as identical — even though Student A’s 80 required a higher level of knowledge and skill to achieve.
Scaling corrects this by looking at how students in each subject perform across all their other subjects. If Specialist Maths students consistently perform well in their other subjects too (suggesting they are a strong cohort), then Specialist Maths gets scaled up. If students in another subject tend to perform poorly across their other subjects, that subject scales down.
Every state in Australia uses some form of scaling, but the method, the body that runs it, and the specific adjustments all differ. The final ATAR, however, is designed to be nationally comparable regardless of which state you sit in.
How Scaling Works — A Simple Explanation
Think of scaling like a currency conversion. If you earned 100 Japanese yen and your friend earned 100 US dollars, you would not say you have the same amount of money. You need to convert both into a common currency before you can compare them. Scaling converts every subject’s raw scores into the same “currency” so that your ATAR can be calculated fairly.
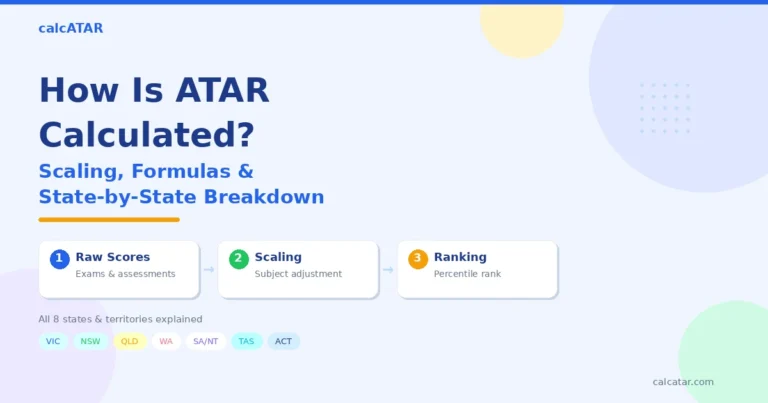
The basic process works like this:
- Collect raw scores. Your exam marks and school-assessed marks are combined (the exact split varies by state).
- Measure the cohort. The system looks at how students in each subject performed across all their other subjects. This is called the “reference group” method — it uses cross-subject performance to gauge cohort strength.
- Adjust the distribution. If a subject’s cohort is stronger than average (meaning its students score well in other subjects too), the entire distribution for that subject gets shifted up. If the cohort is weaker, it shifts down.
- Produce scaled scores. Your raw score is transformed into a scaled score that reflects both your individual performance and the strength of your cohort.
- Calculate the aggregate. Your best scaled scores are combined (the number and weighting depends on your state) into an aggregate, which is then converted into a percentile rank — your ATAR.
Worked Example — VCE (Victoria)
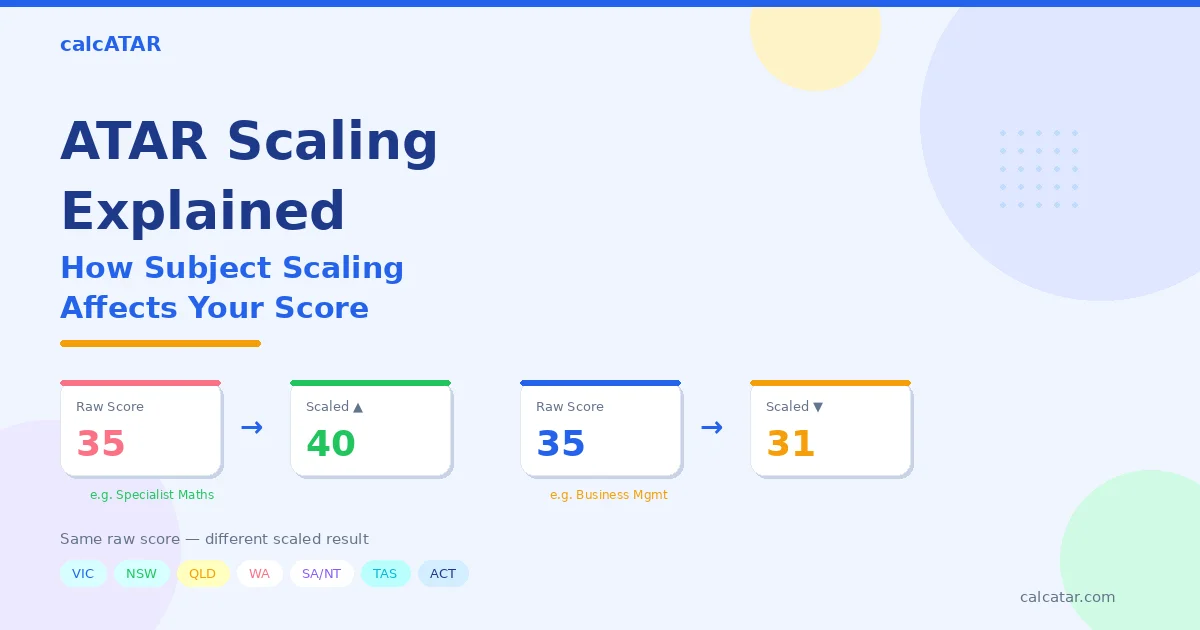
A student scores a raw study score of 35 in both Specialist Maths and Business Management.
After VTAC scaling:
• Specialist Maths 35 → scaled to approximately 48 (a gain of +13 points)
• Business Management 35 → scaled to approximately 32 (a drop of −3 points)
Same raw score, very different scaled scores. The Specialist Maths cohort is stronger across all their subjects, so the scaling reflects that.
How Each State Handles Scaling
Every state uses scaling, but each one does it differently. Here is a state-by-state breakdown of who runs the scaling, how it works, and what makes each system unique.
| State | Curriculum | Scaling Body | Key Feature | Calculator |
|---|---|---|---|---|
| VIC | VCE | VTAC | Study scores scaled to a mean of 30 | VCE Calc |
| NSW | HSC | UAC | Scaled marks from moderated assessment + exam | HSC Calc |
| QLD | QCE | QTAC | Inter-subject scaling of 5 General subjects | QCE Calc |
| WA | WACE | TISC | TEA scaling with 10% bonus for Methods/Specialist | WACE Calc |
| SA & NT | SACE | SATAC | Scaling applied to 70 credits of best results | SACE Calc |
| TAS | TCE | TASC | Best 5 Level 3 subjects scaled | TCE Calc |
| ACT | BSSS | BSSS / ACT Scaling | AST-based scaling across major/minor combos | BSSS Calc |
VCE (Victoria) — VTAC Scaling
VTAC (Victorian Tertiary Admissions Centre) scales every VCE study score so the mean for each subject sits at 30. Subjects with stronger cohorts have their distributions stretched upward — the top scores can reach into the high 40s or even 50s. Subjects with weaker cohorts get compressed.
Your ATAR is calculated from your best 3 scaled study scores (called the “primary four” with English) plus 10% of your next best 7 scaled scores. This “increment” system means even your 5th, 6th, or 7th subject contributes — just at a reduced rate.
The VTAC scaling report is published annually and shows exactly how each subject’s distribution was adjusted. For a full breakdown: How Is ATAR Calculated?
HSC (NSW) — UAC Scaling
UAC (Universities Admissions Centre) scales HSC marks in two steps. First, your school-based assessment marks are moderated against the exam results to ensure consistency across schools. Then, the combined marks are scaled using the same cohort-comparison method.
Your ATAR uses the best 10 units (typically 5 two-unit subjects), and at least 2 units of English must be included. HSC scaling tends to produce larger adjustments for subjects like Maths Extension 2 and Latin, and smaller or negative adjustments for some standard-level courses.
QCE (Queensland) — QTAC Inter-Subject Scaling
Queensland’s system is relatively new (introduced in 2020 when the QCE replaced the OP system). QTAC uses inter-subject scaling across your best 5 General subjects. Each subject’s results are scaled based on the performance of its students in their other subjects.
The scaling method is similar in principle to VTAC and UAC but applied to fewer subjects. Applied and Essential subjects do not count toward the ATAR.
WACE (WA) — TISC TEA Scaling
TISC (Tertiary Institutions Service Centre) calculates the TEA (Tertiary Entrance Aggregate) from your best 4 ATAR courses plus the best 50% of a 5th. Raw marks are combined 50/50 from school assessment and the external exam, then scaled.
WA has a unique feature: Maths Methods and Maths Specialist each receive a 10% bonus on their scaled score, applied after scaling. This is an explicit, built-in incentive to take higher-level maths — not a scaling adjustment, but an additional bonus on top of it.
SACE (SA & NT) — SATAC Scaling
SATAC scales your SACE results across 70 credits from your best performances (typically a mix of 20-credit Stage 2 subjects). South Australia and the Northern Territory share the same curriculum and scaling system.
The scaling uses the same cohort-comparison principle: if the students taking a subject perform well across their other subjects, that subject scales up. Research Project (a compulsory 10-credit subject) is included in your calculation but tends to scale neutrally.
TCE (Tasmania) — TASC Scaling
TASC (Tasmanian Assessment, Standards and Certification) scales your best 5 Level 3 (pre-tertiary) subjects. Tasmania has a smaller cohort than mainland states (around 3,500 students receive an ATAR each year), which means individual subject cohorts can be quite small.
Small cohorts can lead to more volatile scaling — a handful of very strong or weak students can shift the entire distribution for a subject. TASC uses statistical smoothing to mitigate this.
BSSS (ACT) — AST-Based Scaling
The ACT system is unique. Instead of scaling each subject independently, the BSSS uses the AST (ACT Scaling Test) — a common test sat by all Year 12 students — as the anchor. Your course scores are then scaled relative to your AST performance and the AST performance of other students in your courses.
Your ATAR uses your best 3.6 standard units (a combination of majors and minors). The AST itself does not appear on your results, but it directly determines how your course scores are scaled.
Subjects That Typically Scale Up
These subjects consistently scale upward across most states because their student cohorts tend to be strong performers across all their subjects. The table below uses VCE data (raw study score of 35 as baseline) as the primary reference, with notes on other states.
| Subject | VCE: Raw 35 → Scaled | Scaling Direction (All States) | Why It Scales Up |
|---|---|---|---|
| Latin | 35 → ~50 (+15) | Strong up (all states) | Tiny, self-selected cohort of very strong students |
| Specialist Mathematics | 35 → ~48 (+13) | Strong up (all states) | Hardest maths pathway; cohort excels across all subjects |
| Chinese Second Language | 35 → ~45 (+10) | Moderate–strong up | Strong bilingual cohort with high cross-subject performance |
| French | 35 → ~45 (+10) | Moderate–strong up | Small, dedicated cohort; typically high achievers |
| German | 35 → ~44 (+9) | Moderate–strong up | Small, committed cohort |
| Algorithmics (HESS) | 35 → ~43 (+8) | Strong up (VIC only) | Extremely small cohort of maths/IT specialists |
| Mathematical Methods | 35 → ~40 (+5) | Moderate up (all states) | Standard advanced maths; strong cohort |
| Chemistry | 35 → ~39 (+4) | Moderate up (all states) | Science-oriented cohort with solid cross-subject results |
| Physics | 35 → ~37 (+2) | Slight–moderate up | Maths-heavy; cohort tends to perform well in other quantitative subjects |
| Economics | 35 → ~36 (+1) | Slight up (most states) | Analytical subject attracting strong students |
Subjects That Typically Scale Down
These subjects tend to scale down because their student cohorts, on average, perform less strongly across their other subjects. This does not mean these are “bad” subjects — it means the average student taking them is not as strong across the board.
| Subject | VCE: Raw 35 → Scaled | Scaling Direction (All States) | Why It Scales Down |
|---|---|---|---|
| Foundation Mathematics | 35 → ~26 (−9) | Strong down (VIC) | Lowest maths tier; cohort typically weaker across all subjects |
| Agricultural & Horticultural Studies | 35 → ~29 (−6) | Moderate down | Small cohort with lower average cross-subject performance |
| Outdoor & Environmental Studies | 35 → ~30 (−5) | Moderate down | Broad cohort with mixed academic profiles |
| Sociology | 35 → ~31 (−4) | Slight–moderate down | Cohort tends to sit below average in other subjects |
| Visual Communication Design | 35 → ~32 (−3) | Slight down | Design-focused students may not be as strong in academic subjects |
| Business Management | 35 → ~32 (−3) | Slight down (most states) | Very large cohort with wide range of abilities |
| Media | 35 → ~32 (−3) | Slight down | Mixed cohort; practical subject |
| General Mathematics | 35 → ~33 (−2) | Slight down (most states) | Middle-tier maths; weaker cohort than Methods/Specialist |
| Psychology | 35 → ~34 (−1) | Roughly neutral to slight down | Very large cohort; average cross-subject performance |
| English (standard) | 35 → ~33 (−2) | Slight down (VCE/HSC) | Compulsory — includes the full range of abilities |
5 Common Scaling Myths — Busted
Myth 1: “Picking easy subjects gives you a higher ATAR”
Wrong. If a subject is “easy” in the sense that weaker students flock to it, it will scale down. A high raw score in a down-scaling subject can end up lower after scaling than a moderate raw score in an up-scaling subject. The system is specifically designed to prevent this strategy from working.
Myth 2: “Scaling is unfair”
The opposite is true. Without scaling, the system would be unfair — a student who took Specialist Maths and got 80 would be treated the same as a student who took Foundation Maths and got 80, even though the difficulty and cohort strength are completely different. Scaling is the mechanism that creates fairness, not the one that undermines it.
Myth 3: “You should only pick subjects that scale up”
Dangerous advice. Scaling only helps if you perform well. Picking Specialist Maths “for the scaling” and then scoring in the bottom third of the class will hurt your ATAR far more than scoring in the top 10% of a subject that scales down. Your performance within the subject matters more than the subject’s scaling profile.
Myth 4: “Your raw score IS your ATAR”
No. Your raw score is transformed through scaling, aggregation, and percentile ranking before it becomes your ATAR. A raw score of 80 across all your subjects does not automatically produce an ATAR of 80. For a full explanation, read How Is ATAR Calculated?
Myth 5: “Scaling is fixed — the same subjects always scale the same way”
Partially wrong. While the general patterns are fairly stable year to year (Specialist Maths almost always scales up, Foundation Maths almost always scales down), the exact adjustments change with every cohort. A subject that scaled up by +5 last year might scale up by +3 or +7 this year, depending on the strength of the students who chose it.
Should You Pick Subjects Based on Scaling?
I am going to be direct: no, you should not choose subjects primarily because they scale well. Here is why.
Scaling rewards strong performance, not subject choice. A student who scores a raw 40 in Business Management (a subject that scales down by about 3 points) gets a scaled score of roughly 37 — which is still a strong score. A student who forces themselves into Specialist Maths “for the scaling” and scores a raw 25 gets a scaled score around 30 — worse than the Business Management student despite the scaling advantage.
The best subject choice strategy is:
- Pick subjects you genuinely enjoy and are good at. Motivation sustains effort over a full year.
- Check prerequisite requirements for your target university courses. Some courses require specific subjects regardless of ATAR.
- Among subjects you are equally strong in, lean toward the one that scales better — but only as a tiebreaker.
- Never pick a subject you dislike or struggle with just because it “scales well.” The scaling benefit will not compensate for a weak result.
To see how scaling might affect your specific subjects, use the ATAR Scaling Comparison Tool. It shows historical scaling patterns for subjects across states, so you can make an informed decision — not a guess.
How to Use the ATAR Scaling Calculator
The calcATAR Scaling Comparison Tool lets you compare how different subjects scale across states. Here is a quick walkthrough:
- Select your state. Choose VCE, HSC, QCE, WACE, SACE, TCE, or BSSS from the dropdown.
- Pick your subjects. Select the subjects you are currently taking or considering.
- Enter your estimated raw scores. Use your most recent assessment results as a guide.
- View the scaled comparison. The tool shows how each subject’s raw score translates into a scaled score based on historical data.
- Experiment. Try swapping subjects in and out to see how different combinations affect your estimated ATAR.
10 Tips for Navigating ATAR Scaling
1. Performance beats scaling — every time
A high raw score in any subject will produce a respectable scaled score. A low raw score in a high-scaling subject will not save you. Focus on performing well first, and let scaling be a bonus.
2. Use scaling data as a tiebreaker, not a decision-maker
If you are torn between two subjects you are equally interested in and equally capable in, choose the one that scales better. That is the only scenario where scaling should influence your choice.
3. Do not drop a subject you love because it “scales badly”
Passion drives performance. If you love Art and consistently score in the top 10% of your class, you will get a better ATAR result from Art than from a subject you hate and perform poorly in, even if that subject scales up by 10 points.
4. Check university prerequisites before anything else
Some courses require specific subjects regardless of ATAR. If you need Maths Methods for Engineering, the scaling is irrelevant — you need the subject. Always start with prerequisites.
5. Remember that scaling changes every year
Historical patterns are a useful guide, but the exact scaling adjustments shift with every cohort. Do not rely on a single year’s data to make a two-year decision. Look at trends across 3–5 years.
6. Understand how your state counts subjects
Victoria counts your best 3 plus increments of 7 more. NSW counts your best 10 units. WA counts 4 plus half of a 5th. Knowing the formula tells you which subjects matter most and where scaling has the biggest impact. Read the full breakdown at How Is ATAR Calculated?
7. Talk to students who actually took the subject
Scaling data tells you about the cohort. It does not tell you about the teaching quality at your school, the workload, or whether the assessment style suits you. Talk to Year 12 graduates from your school.
8. Languages are a hidden scaling gem — if you are already bilingual
Languages consistently scale up strongly, but only because the cohort is self-selected and strong. If you are already fluent or near-fluent in a language, taking it as a subject can give you a significant scaling boost with relatively less study effort.
9. Do not confuse high enrolments with low scaling
Psychology and Business Management have huge enrolments and scale down slightly — but a top-10% score in either still produces a solid scaled result. Large cohorts mean more competition, but also more room at the top.
10. Run the numbers before committing
Use the Scaling Comparison Tool to model different scenarios. Plug in your estimated raw scores for different subject combinations and see which one produces the highest estimated ATAR. Data beats guesswork.
Frequently Asked Questions
Final Thoughts
Scaling is not a punishment and it is not a reward. It is a statistical adjustment that makes it possible to compare students who chose completely different subject combinations. Without it, the ATAR would be meaningless — a student taking five high-scaling subjects would be directly compared to a student taking five low-scaling subjects, with no way to account for the difference in cohort strength.
The single most important takeaway: pick subjects you will perform well in. A high raw score in any subject will always serve you better than a mediocre score in a subject you chose purely for its scaling advantage. Scaling amplifies strong performance — it does not create it.
To see how scaling might affect your specific subject combination, use the Scaling Comparison Tool or estimate your ATAR with your state’s calculator: VCE · HSC · QCE · WACE · SACE · TCE · BSSS
— Daniel Mitchell, calcATAR